 Pori
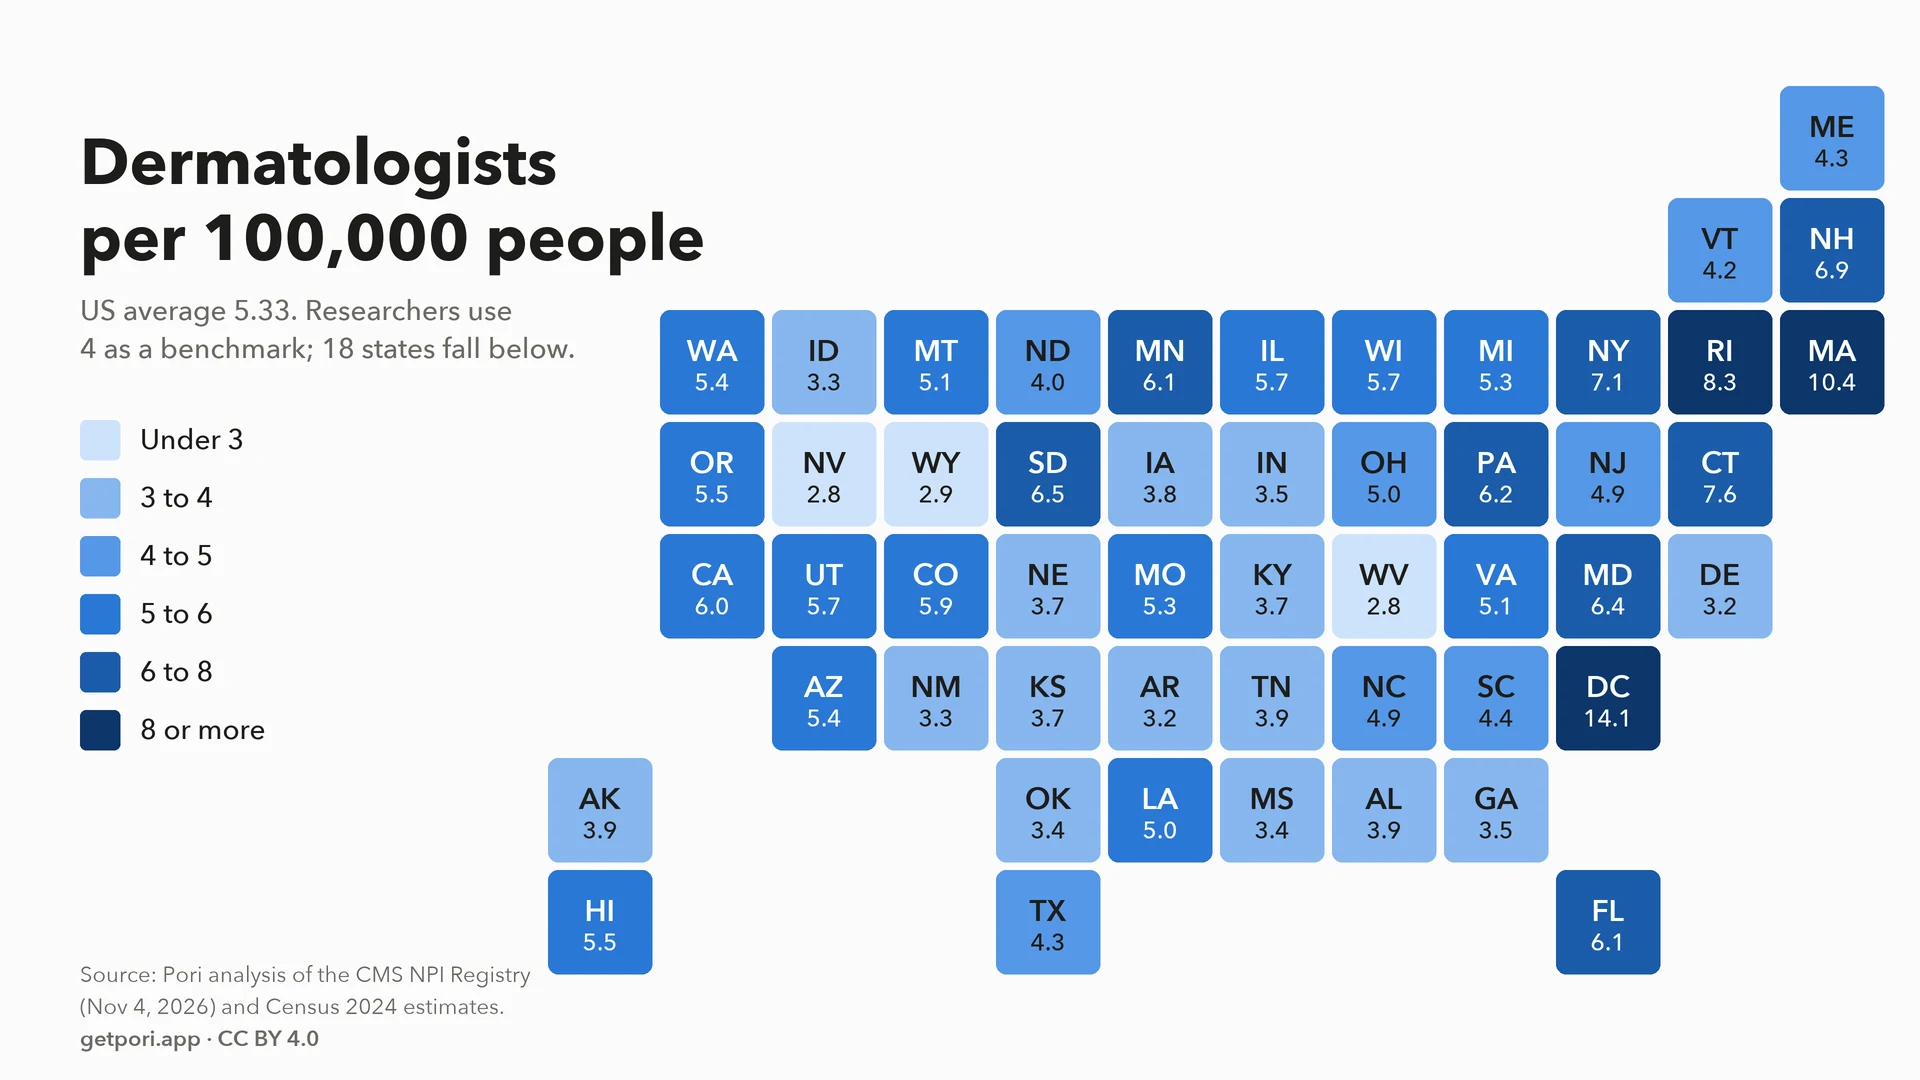
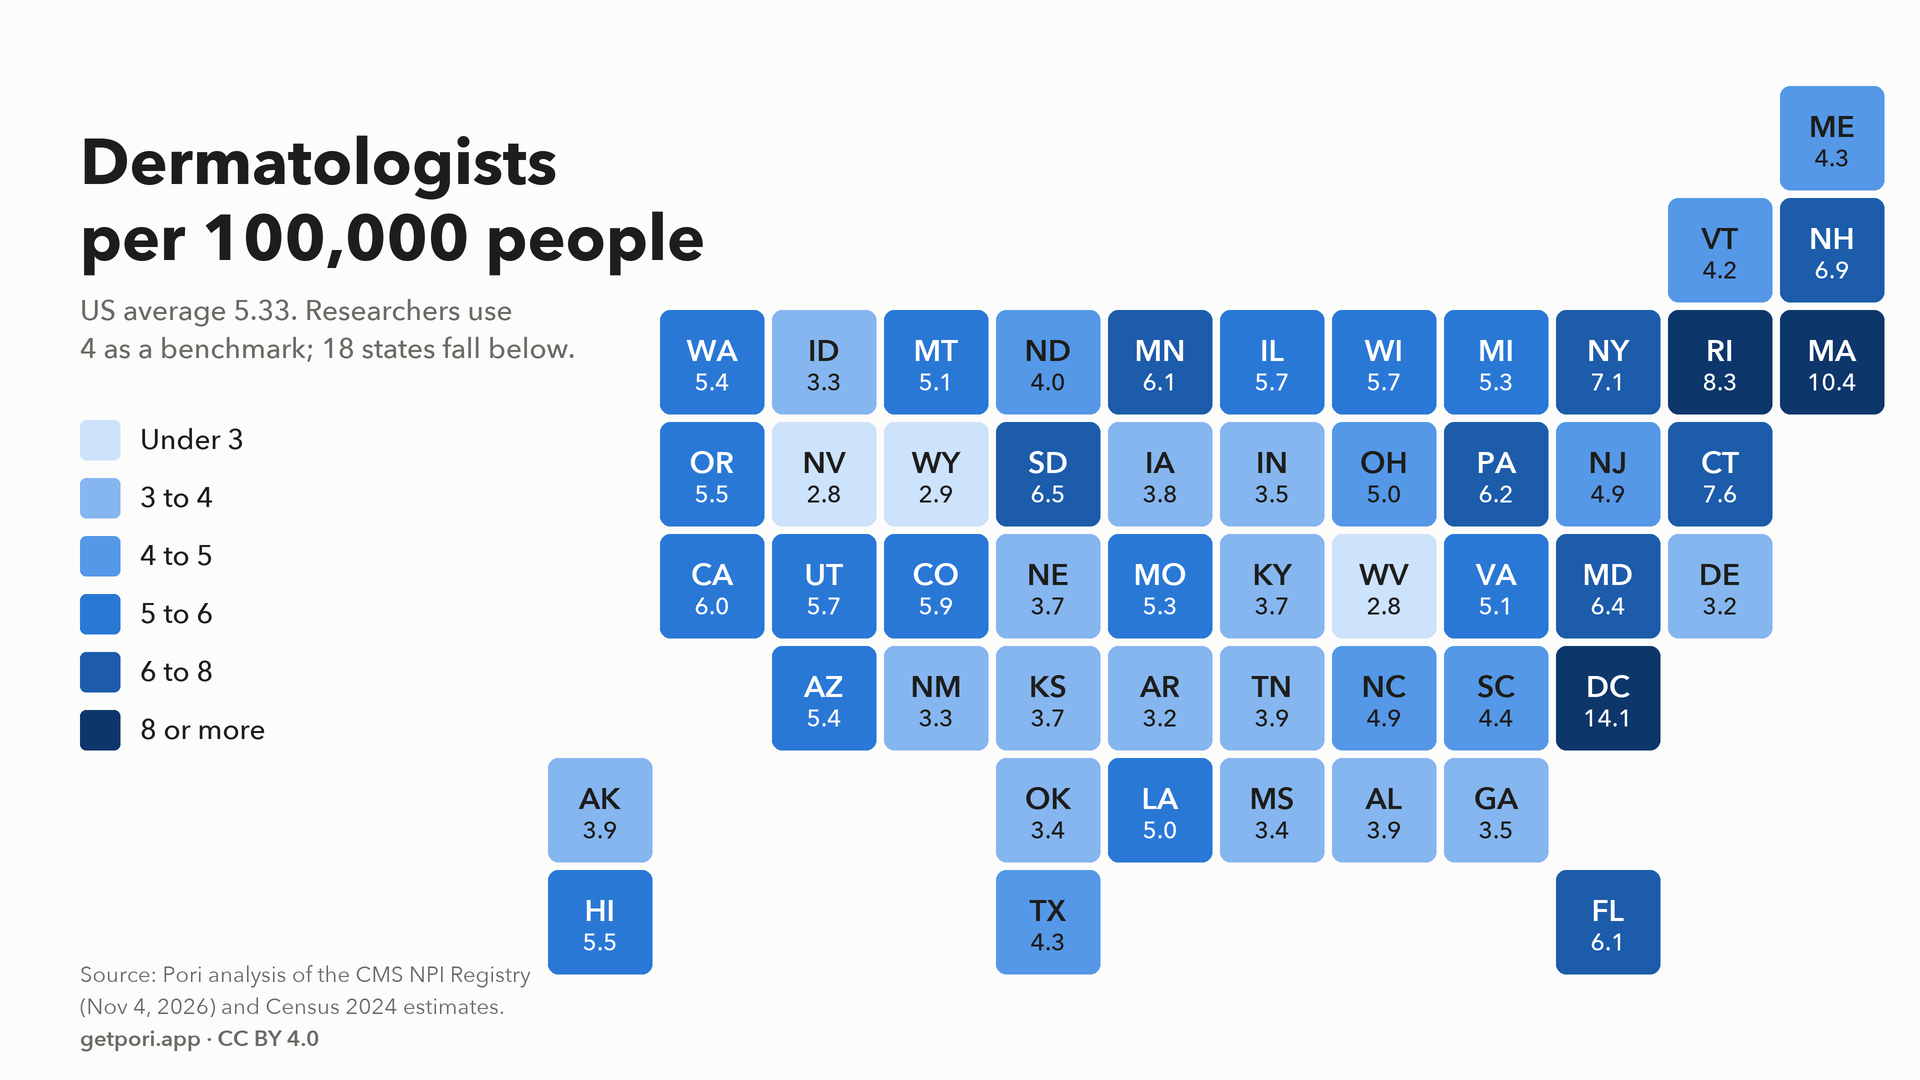
- The US has 5.33 dermatologists per 100,000 people, from 2.77 in West Virginia to 10.38 in Massachusetts; 18 states are below 4.
- Dermatologists follow income and cities: 6.06 per 100,000 in the richest third of states against 4.54 in the poorest, 5.87 in the most urban third against 3.88 in the most rural.
- New dermatologists settle where many already practice, so the gap is growing; skin cancer rates do not predict where dermatologists are.
- Only 624 doctors list pediatric dermatology; the data are free to reuse under CC BY 4.0, with a CSV.
Where you live decides how hard it is to see a dermatologist. Massachusetts has 10.38 dermatologists for every 100,000 people; West Virginia has 2.77. We counted all 18,111 dermatologists in the federal NPI Registry as of November 4, 2026, matched them to Census data and cancer statistics, and found that the gap follows money, cities and the places young dermatologists choose to settle. It does not follow the risk of skin cancer.
If you need one now, our free dermatologist directory lists every registered dermatologist by state and city, with no sponsored listings. Between visits, the photo diary in Pori keeps dated, consistent photos of your skin to show a doctor; Pori does not diagnose skin conditions.
What did we find?
- A 3.7-fold gap between states. Massachusetts has 10.38 dermatologists per 100,000 people and West Virginia has 2.77; the national figure is 5.33. Washington, DC, a single city, has 14.1.
- 18 states fall below 4 per 100,000, the ratio a 2026 Texas study called recommended: West Virginia, Nevada, Wyoming, Delaware, Arkansas, Idaho, New Mexico, Oklahoma, Mississippi, Indiana, Georgia, Kentucky, Kansas, Nebraska, Iowa, Tennessee, Alabama, Alaska.
- Dermatologists follow income. The richest third of states has 6.06 per 100,000; the poorest third has 4.54.
- And cities. The most urban third of states has 5.87 per 100,000; the most rural third has 3.88.
- The gap is growing. Dermatologists who joined the registry since 2016 settled mostly where many already practice: 2.93 new ones per 100,000 people in Massachusetts against 0.17 in Wyoming.
- Skin cancer risk does not draw doctors. Melanoma rates and dermatologist ratios show no relationship across the states. Vermont, Iowa and Idaho all have melanoma rates well above the US average of 23.8 new cases per 100,000 a year, yet rank 32nd, 37th and 46th of 51 for dermatologists per person.
- Children have it worst. Only 624 doctors list pediatric dermatology. In Hawaii no doctor lists it, and 12 more states have one or two. General dermatologists there still see children; what is missing is the specialist for the hard cases.
Which states have the most and fewest dermatologists per person?
The table ranks the 50 states and Washington, DC. "New per 100,000" counts dermatologists who first registered for an NPI number in 2016 or later, a rough measure of how many recently trained doctors a state has drawn. Melanoma is the age-adjusted rate of new cases per 100,000 people a year, 2019 to 2023, from the National Cancer Institute. Each state links to its page in our directory, and you can download the full data as a CSV.
| Rank | State | Dermatologists | Per 100,000 | New per 100,000 | Pediatric | Melanoma rate |
|---|---|---|---|---|---|---|
| 1 | District of Columbia | 99 | 14.1 | 3.84 | 5 | 11.3 |
| 2 | Massachusetts | 741 | 10.38 | 2.93 | 25 | 16.8 |
| 3 | Rhode Island | 92 | 8.27 | 1.17 | 1 | 20.0 |
| 4 | Connecticut | 279 | 7.59 | 1.55 | 7 | 18.9 |
| 5 | New York | 1,413 | 7.11 | 1.52 | 55 | 18.2 |
| 6 | New Hampshire | 97 | 6.88 | 1.21 | 5 | 28.2 |
| 7 | South Dakota | 60 | 6.49 | 1.62 | 1 | 33.2 |
| 8 | Maryland | 400 | 6.39 | 1.1 | 10 | 26.0 |
| 9 | Pennsylvania | 806 | 6.16 | 1.47 | 30 | 20.0 |
| 10 | Florida | 1,433 | 6.13 | 1.17 | 42 | 26.8 |
| 11 | Minnesota | 354 | 6.11 | 1.8 | 7 | 40.5 |
| 12 | California | 2,349 | 5.96 | 1.05 | 104 | 23.8 |
| 13 | Colorado | 353 | 5.93 | 1.26 | 15 | 23.9 |
| 14 | Illinois | 730 | 5.74 | 1.68 | 19 | 24.7 |
| 15 | Wisconsin | 341 | 5.72 | 1.43 | 16 | 27.0 |
| 16 | Utah | 198 | 5.65 | 1.63 | 6 | 43.8 |
| 17 | Oregon | 235 | 5.5 | 1.19 | 6 | 24.9 |
| 18 | Hawaii | 79 | 5.46 | 0.69 | 0 | 25.7 |
| 19 | Washington | 431 | 5.42 | 1.06 | 11 | 26.7 |
| 20 | Arizona | 409 | 5.39 | 1.23 | 20 | 33.6 |
| 21 | Missouri | 332 | 5.32 | 1.36 | 10 | 21.4 |
| 22 | Michigan | 537 | 5.3 | 1.43 | 17 | 21.4 |
| 23 | Virginia | 450 | 5.11 | 0.94 | 13 | 20.5 |
| 24 | Montana | 58 | 5.1 | 1.23 | 1 | 27.1 |
| 25 | Louisiana | 231 | 5.02 | 0.76 | 4 | 19.2 |
| 26 | Ohio | 592 | 4.98 | 1.21 | 24 | 28.6 |
| 27 | North Carolina | 542 | 4.91 | 0.82 | 8 | 29.8 |
| 28 | New Jersey | 463 | 4.87 | 0.68 | 13 | 21.3 |
| 29 | South Carolina | 242 | 4.42 | 1.22 | 6 | 23.5 |
| 30 | Texas | 1,350 | 4.31 | 1.04 | 48 | 15.9 |
| 31 | Maine | 60 | 4.27 | 0.5 | 1 | 27.5 |
| 32 | Vermont | 27 | 4.16 | 0.93 | 1 | 35.1 |
| 33 | North Dakota | 32 | 4.02 | 1.0 | 1 | 32.1 |
| 34 | Alaska | 29 | 3.92 | 1.08 | 2 | 16.4 |
| 35 | Alabama | 201 | 3.9 | 0.89 | 5 | 20.7 |
| 36 | Tennessee | 279 | 3.86 | 0.65 | 10 | 20.5 |
| 37 | Iowa | 124 | 3.83 | 1.23 | 10 | 33.7 |
| 38 | Kansas | 111 | 3.74 | 1.21 | 3 | 28.7 |
| 39 | Nebraska | 75 | 3.74 | 1.15 | 7 | 28.8 |
| 40 | Kentucky | 170 | 3.71 | 0.63 | 8 | 29.7 |
| 41 | Georgia | 396 | 3.54 | 0.75 | 15 | 24.9 |
| 42 | Indiana | 244 | 3.52 | 0.61 | 5 | 20.8 |
| 43 | Mississippi | 101 | 3.43 | 0.99 | 1 | 19.7 |
| 44 | Oklahoma | 138 | 3.37 | 0.76 | 7 | 22.6 |
| 45 | New Mexico | 71 | 3.33 | 0.52 | 3 | 18.4 |
| 46 | Idaho | 66 | 3.3 | 0.6 | 2 | 32.3 |
| 47 | Arkansas | 100 | 3.24 | 0.68 | 7 | 26.4 |
| 48 | Delaware | 34 | 3.23 | 0.38 | 1 | 23.6 |
| 49 | Wyoming | 17 | 2.89 | 0.17 | 2 | 28.5 |
| 50 | Nevada | 91 | 2.79 | 0.46 | 3 | 23.0 |
| 51 | West Virginia | 49 | 2.77 | 0.62 | 1 | 25.9 |
Why does Massachusetts have nearly four times as many dermatologists per person as West Virginia?
No single factor explains it, and our numbers show associations, not proof of cause. But four patterns line up across the 50 states, and published research points to the same mechanisms.
1. Dermatologists go where patients can pay
States with higher household incomes have more dermatologists per person (Spearman's rank correlation 0.54, a moderate-to-strong link on a scale from -1 to 1). Grouped into thirds, the gap is plain:
| Group of 16 states | Dermatologists per 100,000 |
|---|---|
| Richest third of states by household income | 6.06 |
| Poorest third of states by household income | 4.54 |
| Most urban third of states | 5.87 |
| Most rural third of states | 3.88 |
One likely reason is what dermatology sells: alongside medical care, many practices offer cosmetic treatments that patients pay for in cash, and that demand is easier to build where incomes are high. Insurance is the other part, and here the research is clear. When researchers posed as new patients and called 611 US dermatology clinics in 28 states, 96% gave an appointment to a caller with Blue Cross Blue Shield, 94% to one with Medicare and 17% to one with Medicaid, and Medicaid patients who did get in waited a median of 13 days against 7 (JAMA Dermatology, 2021). An earlier study of 13 cities found that 44% of dermatologists listed by Medicaid plans refused a new child with eczema who was covered by Medicaid. Poorer states tend to have more residents covered by Medicaid, and a practice that limits Medicaid has fewer patients it wants to see.
2. Dermatologists cluster in cities, even inside sparse states
The share of a state's people living in urban areas is linked to its dermatologist ratio (rank correlation 0.46). Most urban third of states: 5.87 per 100,000. Most rural third: 3.88. Within states the pull of one city is striking:
- Nebraska: 68% of its 75 dermatologists practice in Omaha.
- New Mexico: 62% of its 71 dermatologists practice in Albuquerque.
- Hawaii: 59% of its 79 dermatologists practice in Honolulu.
- North Dakota: 56% of its 32 dermatologists practice in Fargo.
- Alaska: 55% of its 29 dermatologists practice in Anchorage.
- South Dakota: 53% of its 60 dermatologists practice in Sioux Falls.
County data show the same thing at a finer grain. A 2026 preprint found 6.5 dermatologists per 100,000 people in the most urban US counties and 0.21 in the most rural, and rural households were also less likely to have broadband, which limits video visits as a fix. In Texas, researchers found that only 2 public health regions met the ratio of 4 per 100,000 in 2022, and that areas with fewer than 5,000 people were losing dermatologists while the state total grew.
3. New dermatologists settle where dermatologists already are
This is the pattern that makes the gap self-reinforcing. Of the 18,111 dermatologists we counted, 3,926 first registered for an NPI number in 2016 or later, which for most means they trained in the last decade. States that already had many dermatologists drew far more of these newcomers per person (rank correlation 0.76, the strongest link in our data):
- Most new dermatologists per 100,000 people: Massachusetts (2.93), Minnesota (1.8), Illinois (1.68), Utah (1.63), South Dakota (1.62).
- Fewest: Wyoming (0.17), Delaware (0.38), Nevada (0.46), Maine (0.5), New Mexico (0.52).
- Oldest workforces: in Wyoming, Maine, Delaware and Hawaii, only 6%, 12%, 12% and 13% of dermatologists registered since 2016, so these states will lose doctors to retirement faster than they replace them unless something changes.
Training is a likely part of the reason: dermatology residencies are based at academic medical centers, mostly in large cities, and many doctors build their practice near where they trained. Our data cannot test this directly. Some programs now add rural rotations to counter this; a 2023 Canadian paper proposed rural education as a possible answer to the geographic maldistribution of dermatologists.
4. Ownership is changing who you see
Private equity firms have bought many dermatology practices over the past decade. In a national study, private-equity-owned practices in dermatology, gastroenterology and ophthalmology charged an average of 20.2% more per claim after acquisition than matched practices (JAMA Health Forum, 2022). In the secret-shopper study above, private-equity-owned dermatology clinics were more likely to offer a new patient an appointment with a nurse practitioner or physician assistant than with a dermatologist (80% against 63%) and more likely to have no dermatologist opening at all (16% against 6%). Our registry data cannot show which practices are investor-owned, so we cannot map this by state, but it affects whom a new patient sees in any state.
Does skin cancer risk match where dermatologists are?
No. Across the states, melanoma rates and dermatologist ratios have essentially no relationship (rank correlation -0.08). The states with the most melanoma are Utah, Minnesota, Vermont, Iowa, Arizona and South Dakota. Several of them have fewer dermatologists per person than the national average of 5.33:
| State | Melanoma, new cases per 100,000 a year | Dermatologists per 100,000 | Rank |
|---|---|---|---|
| Vermont | 35.1 | 4.16 | 32 of 51 |
| Iowa | 33.7 | 3.83 | 37 of 51 |
| Idaho | 32.3 | 3.3 | 46 of 51 |
| North Dakota | 32.1 | 4.02 | 33 of 51 |
| North Carolina | 29.8 | 4.91 | 27 of 51 |
| Kentucky | 29.7 | 3.71 | 40 of 51 |
| Nebraska | 28.8 | 3.74 | 39 of 51 |
| Kansas | 28.7 | 3.74 | 38 of 51 |
Melanoma rates are higher in states with older and lighter-skinned populations and more sun exposure, and in places where more skin checks find more cancers, so these numbers are not a measure of unmet need on their own. But they show that the supply of dermatologists is shaped by markets and training, not by where skin cancer is most common.
Who fills the gap where dermatologists are scarce?
Mostly family doctors. A 2026 study of family physicians certified by the American Board of Family Medicine found that those in counties with no dermatologist were 11.9% more likely to perform office-based skin procedures than those in counties with many dermatologists. Nurse practitioners and physician assistants also see many skin patients, but most of them register under their own profession in the NPI Registry rather than under dermatology, so we cannot count them reliably by state. Teledermatology helps with rashes and acne, but it depends on broadband, which the rural areas with the fewest dermatologists are least likely to have.
Where are pediatric dermatologists?
Children with severe eczema, birthmarks, hemangiomas or acne often wait longest, because specialists are rare. These are the states with two or fewer doctors who list pediatric dermatology:
| State | Pediatric dermatologists | Population |
|---|---|---|
| Hawaii | 0 | 1,446,146 |
| Delaware | 1 | 1,051,917 |
| Maine | 1 | 1,405,012 |
| Mississippi | 1 | 2,943,045 |
| Montana | 1 | 1,137,233 |
| North Dakota | 1 | 796,568 |
| Rhode Island | 1 | 1,112,308 |
| South Dakota | 1 | 924,669 |
| Vermont | 1 | 648,493 |
| West Virginia | 1 | 1,769,979 |
| Alaska | 2 | 740,133 |
| Idaho | 2 | 2,001,619 |
| Wyoming | 2 | 587,618 |
A registry listing is not the same as board certification, and many general dermatologists treat children, so read these as a count of doctors who call themselves pediatric dermatologists, not of everyone who sees kids. Nationally, 2,465 dermatologists list Mohs surgery, the skin cancer surgery done by specially trained dermatologists, and 9,459 of 18,111 (52%) list their sex as female.
What can you do if there are few dermatologists near you?
- Start with your primary care doctor. Many common problems, like acne, eczema and fungal rashes, can be treated there, and a referral letter can move you up a dermatology waiting list.
- Ask about teledermatology. Video and photo-based visits work well for many rashes and for acne; see our guide to teledermatology apps.
- Do not wait on a changing spot. A new or changing mole, a sore that will not heal or a bleeding spot needs an in-person exam; our guide to skin cancer signs explains what to look for.
- Ask about cancellations and nurse practitioner visits if the wait for a dermatologist is long, and say plainly if a spot is changing.
- Search beyond your city. Our directory lists every registered dermatologist by city, so you can see who practices within driving distance.
How did we count?
We downloaded the NPPES NPI files from the Centers for Medicare & Medicaid Services on November 4, 2026. We kept individual providers with a dermatology taxonomy (dermatology, Mohs surgery, procedural dermatology, pediatric dermatology or dermatological immunology) and removed nurse practitioners and physician assistants filed under dermatology, leaving 18,111 physicians in the 50 states and DC. Each one is counted once, in the state of their first listed practice location, or their mailing address if none is listed.
We compared those counts with the Census Bureau's Vintage 2024 population estimates, median household income for 2025 from the Census Bureau's historical income table H-8, the urban share of each state's population in the 2020 Census, and age-adjusted melanoma incidence for 2019 to 2023 from the National Cancer Institute's State Cancer Profiles. Correlations are Spearman rank correlations across the 50 states (DC left out because it is a single city); "thirds" are groups of states ranked by income or urban share.
Limits worth knowing. Providers update the registry themselves, so some retired doctors and doctors in training may still be listed, and doctors who work in several states are counted once. The NPI start date is a proxy for career stage: doctors who were already practicing when the NPI began in 2005 to 2007 all show early dates. Subspecialty counts reflect what doctors chose to list, not board certification. Correlation is not causation: income, urban share and training centers move together, and our data cannot separate them.
Can I use this data?
Yes. The tables, the CSV and the findings are free to republish under CC BY 4.0. Please credit "Pori" and link to this page. The CSV has every state with all the columns above, so reporters can build their own state or regional story from it. A ready-to-use map of dermatologists per 100,000 people by state (PNG) is free to reuse on the same terms.
Frequently asked questions
Which state has the most dermatologists per person?
Massachusetts, with 10.38 per 100,000 residents in our count of the NPI Registry as of November 4, 2026. Washington, DC, a single city, is higher at 14.1.
Which state has the fewest dermatologists per person?
West Virginia, with 2.77 per 100,000 residents, followed by Nevada (2.79) and Wyoming (2.89).
Why are there so few dermatologists in some states?
In our data, dermatologists are concentrated in higher-income and more urban states, and recently trained dermatologists settle mostly where many already practice. Published studies add low Medicaid acceptance and the pull of academic training centers in large cities.
Are there more dermatologists where skin cancer is more common?
No. Across the 50 states, melanoma rates and dermatologists per person show essentially no relationship (rank correlation -0.08). Vermont has 35.1 new melanoma cases per 100,000 a year, against a US rate of 23.8, and ranks 32 of 51 for dermatologists per person.
How many dermatologists are there in the US?
We counted 18,111 physicians with a dermatology specialty in the 50 states and DC in the federal NPI Registry as of November 4, 2026. Other sources give different totals because they define active practice differently.
Can I use these numbers in an article?
Yes. The data and findings are free to republish under CC BY 4.0. Credit Pori and link to this page; the CSV has every state.
Sources
- CMS NPPES: NPI downloadable files (accessed November 4, 2026)
- U.S. Census Bureau: State population totals, Vintage 2024
- U.S. Census Bureau: Historical income tables, households (table H-8)
- U.S. Census Bureau: Urban and rural (2020 Census)
- National Cancer Institute: State Cancer Profiles, melanoma incidence 2019-2023
- Creadore et al., Insurance acceptance, appointment wait time, and dermatologist access across practice types in the US, JAMA Dermatology, 2021
- Chaudhry et al., Pediatric access to dermatologists: Medicaid versus private insurance, JAAD, 2013
- Singh et al., Private equity acquisition of physician practices and changes in spending and utilization, JAMA Health Forum, 2022
- Variation in family physician dermatology care by dermatologist availability, Family Medicine, 2026
- Dawamne et al., Disparities in access to dermatological care in Texas counties, Proc (Bayl Univ Med Cent), 2026
- Wingert et al., Broadband access and dermatologist density in the United States (preprint), 2026
- Li et al., Rural educational opportunities in dermatology residency programs, J Cutan Med Surg, 2023
Pori is a wellness and skincare education app, not a medical device. This article is for general information and isn't medical advice. For anything that worries you, see a dermatologist.